


In today’s competitive customer service landscape, call centers play a pivotal role in shaping brand perception and loyalty. Knowing which metrics truly impact customer experience is essential for managers looking to improve both efficiency and satisfaction.
The global call center market was valued at $352.4 billion in 2024 and is projected to reach $500.1 billion by 2030, reflecting rapid growth as businesses invest in customer experience. This surge underscores the need for actionable insights that guide service quality improvements. The same research shows 77% of customers expect to reach someone immediately when contacting a company, while 71% expect personalized interactions and 76% become frustrated if they don’t receive them.
And the cost of missing the mark is steep: 86% of customers say they’re willing to leave a brand after just two poor experiences. These numbers highlight why tracking and optimizing key call center metrics is critical for both short-term satisfaction and long-term retention

Customer Experience Metrics
Customer experience (CX) metrics help gauge how effectively your contact center meets customer expectations. These indicators focus on satisfaction, loyalty, and the overall quality of interactions.
Customer Satisfaction Score (CSAT)
CSAT captures how satisfied customers are with a specific interaction. It’s typically gathered through post-interaction surveys asking customers to rate their satisfaction on a scale (e.g., 1–5).
The American Customer Satisfaction Index ties higher satisfaction to stronger loyalty and retention, and SQM reports that each one-point gain in first call resolution tends to lift CSAT by about one point. Contact centers that sustain CSAT of 85% or higher also see markedly better retention than those below 75%, reinforcing that efficient service, empathetic agents, and thorough resolution drive the score.
Net Promoter Score (NPS)
Net Promoter Score (NPS) gauges customer loyalty by asking how likely a customer is to recommend your company to others. Responses are scored on a scale of 0–10, with “promoters” at the top end, “passives” in the middle, and “detractors” at the bottom. Retently’s 2025 NPS Benchmarks show healthcare’s average NPS surpasses 50, reinforcing how customer-centric sectors translate experience into advocacy. This reflects how brands that prioritize each interaction and act quickly on feedback tend to outperform their competitors in customer advocacy. Tracking NPS helps call centers identify loyalty trends and potential churn risks.
Customer Effort Score (CES)
Customer Effort Score (CES) measures how easy it is for customers to get their issue resolved. A lower effort score means a smoother customer journey, while high effort often signals pain points that need attention. Research from Gartner shows that customers who experience high effort in resolving issues are 96% more likely to become disloyal, while reducing customer effort can increase repurchase intent by up to 94% and lower operational costs by 37% compared to high-effort interactions (Gartner via Interactions.com). The essence of reducing customer effort, rather than merely trying to delight, has long been recognized as key to driving loyalty and repeat business. For call centers, this might mean improving self-service tools or simplifying IVR menus.
Sentiment Analysis
Call Sentiment Analysis evaluates emotional tone in customer interactions to help teams understand satisfaction drivers beyond survey scores. By monitoring shifts in sentiment over time, leaders can spot friction, tailor coaching, and prioritize process fixes that impact CX. According to Forrester’s US Customer Experience Index 2023, although many brands struggled with declining CX quality in 2023, those that leverage customer analytics, including sentiment analysis, are better positioned to improve customer satisfaction, strengthen loyalty, and reduce churn risk over time. This data-driven focus on customer insights is critical to reversing the downward CX trends seen across many industries.
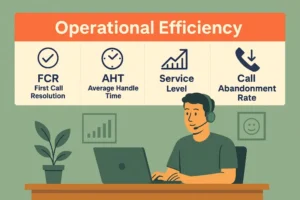
Operational Efficiency
Operational efficiency metrics measure how effectively a call center uses its resources to deliver timely, high-quality service. By monitoring these indicators, managers can spot inefficiencies, reduce costs, and improve the overall customer experience.
First Call Resolution (FCR)
First Call Resolution (FCR) tracks the percentage of issues resolved in a single interaction. Improving FCR reduces repeat contacts, lowers handling costs, and typically correlates with better satisfaction. According to Nextiva’s 2025 Call Center Benchmarks, the average FCR across industries is around 70–75%, while top‑performing contact centers aim for 80% or higher. Achieving even small gains can have a measurable effect, higher FCR rates directly drive better CSAT and lower operating costs. A practical approach is empowering agents with better knowledge bases and clearer escalation paths.
Average Handle Time (AHT)
Average Handle Time (AHT) is the average duration of a customer interaction, including talk time, hold time, and after-call work. While lower handle times might seem ideal, modern contact centers balance efficiency with quality. According to the Sobot 2025 Average Handle Time Benchmarks, industries like retail aim for AHTs of around 3 to 5 minutes, while more complex sectors like healthcare typically target 6 to 8 minutes. This shift reflects customer expectations favoring thorough resolution over speed alone. Aligning AHT with customer needs helps ensure efficient calls without rushing, leading to higher satisfaction and better outcomes.
Service Level
Service Level measures the percentage of incoming calls answered within a predetermined time threshold, commonly set at 20 seconds. According to Nubitel’s 2025 Call Center KPI Benchmarks, the industry standard service level is to answer 80% of calls within 20 seconds, which is key to minimizing customer wait time and abandonment. Meeting or exceeding this benchmark supports higher customer satisfaction and loyalty by ensuring prompt responsiveness.
Call Abandonment Rate
Call Abandonment Rate measures the percentage of callers who hang up before reaching an agent. A high abandonment rate often signals long wait times, confusing IVR menus, or understaffing issues. According to Sprinklr’s 2025 call center statistics, an abandonment rate of less than 5% is considered good for call center efficiency. Monitoring and reducing this metric is key to boosting customer satisfaction, protecting revenue, and improving operational performance.
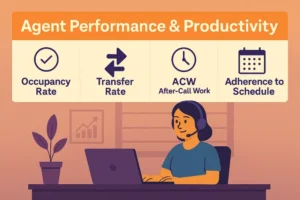
Agent Performance & Productivity
Great CX depends on how effectively agents use their time and tools. These KPIs surface coaching opportunities and process fixes that increase consistency without creating burnout.
Occupancy Rate
Occupancy Rate is the share of logged-in time agents spend helping customers or finishing wrap-up. It’s a productivity lever and a burnout risk: most contact centers target 85–90% occupancy rate to balance throughput with recovery time; sustained stretches above 90% often trigger errors and attrition. Use trend reviews to tune staffing, routing, and breaks so occupancy stays in the healthy band and service quality holds.
Transfer Rate
Transfer Rate captures how often a customer is passed to another agent or queue before resolution. Elevated transfer rates usually signal routing errors, unclear case ownership, or knowledge gaps, and they’re linked to poorer customer perceptions of the interaction. Aim for 15% or less (industry average is 19%); transfers are linked to lower CSAT (-12%) and FCR (-14%) than non-transferred calls, so reducing avoidable handoffs meaningfully protects experience.
Review transfers by topic, then tighten IVR paths, clarify handoff rules, and coach common knowledge misses; don’t penalize mandated transfers like secure billing steps.
After-Call Work (ACW)
After-Call Work (ACW) is the time agents spend on post-interaction tasks. It’s the documentation and follow-ups that complete an interaction, and it’s part of Average Handle Time (AHT). Across contact centers, the average ACW is approximately 45 seconds; many teams set a 30–90 second target depending on complexity, with high performers often under about a minute. Trim ACW by standardizing note templates, auto-populating CRM fields, and capturing dispositions during the call so After-Call Work shrinks without sacrificing accuracy; driving ACW toward zero usually comes back as repeat contacts or QA deductions.
Call Center Schedule Adherence
Call Center Schedule Adherence shows how closely agents follow planned states (log-ins, breaks, activities). A practical target many teams use is around 90% adherence, adjusted by queue and channel; coach patterns rather than one-offs and align expectations with occupancy and ACW.
Quality Assurance & Compliance
QA is a loop: define the service you want, measure it fairly, coach it up, and meet regulatory requirements. These KPIs keep quality consistent and risk low.
Quality Assurance (QA) Score
A calibrated QA program evaluates clarity, accuracy, empathy, and required steps, then feeds targeted coaching. Teams that consistently track and act on QA metrics report meaningful CX lift, as much as 10–15%. Use your Quality Assurance Score to prioritize themes over isolated dings, and watch FCR/CSAT move with the coaching.
Script Adherence
Scripts should ensure must-say items without turning agents into robots. In practice, rigid scripts often need iteration. A research study from Balto’s Conversation Excellence Lab found that nearly two-thirds of agents want to change their scripts, and the more agents are involved in writing them, the more likely they are to follow them. Track Script Adherence for compliance and consistency, then refine scripts so they support natural conversation (and your agents’ happiness).
Compliance Rate
Compliance Rate is the share of interactions that meet legal, regulatory, or internal policy requirements, such as disclosures and verification. Tag misses by category so you can fix tooling gaps, training issues, or process flaws quickly.
Compliance is being prioritized more than ever. In a July 2025 survey by Sobot, 61% of contact center professionals cited staying updated on regulatory changes as a top strategic focus, while 77% of security and IT leaders reported plans to adopt compliance frameworks like PCI DSS 4.0 within the next year. Additionally, 53% said managing data privacy effectively is now essential to their overall compliance efforts.
Monitoring Coverage
Monitoring coverage is the percentage of interactions your QA team actually reviews. Manual programs often sample only a sliver of volume, which can hide systemic issues. NICE notes manual QA typically reviews 2–5% of total interactions, while AI-driven QA approaches can evaluate close to 100% for pattern detection and coaching at scale.
A long-running Call Centre Helper poll also found that over two-thirds of centers only monitor 0–6 calls per agent per month, illustrating how thin many sampling programs still are. Set a risk-based target by channel, increase breadth with light-touch micro-reviews, and use full scorecards on high-risk journeys.
Workforce Management & Forecasting
Even the best agents cannot overcome mismatched staffing. WFM KPIs help you meet demand, protect agent health, and keep responsiveness promises.
Forecast Accuracy
Forecast Accuracy determines whether you meet service promises without overstaffing. Staff costs typically account for about 70% of a contact center’s total expenses, so even small improvements in forecasting accuracy can protect both customer experience and budget. According to CallCriteria’s 2025 workforce management insights, measuring interval-level forecast accuracy (at 15-minute intervals rather than just daily totals) is essential, since these granular patterns directly influence queues and wait times. Pair accuracy measurements with consistent error metrics like Mean Absolute Percentage Error (MAPE) and analyze forecast bias separately from random error for continuous improvement.
Shrinkage
Shrinkage is the percentage of paid time that agents are unavailable to handle interactions, including breaks, meetings, training, paid time off, and absenteeism. Effective workforce planning requires realistic shrinkage estimates by queue and daypart to maintain service levels and prevent last-minute staffing crises. According to HiredSupport’s 2025 overview, a well-managed call center typically targets a shrinkage rate of 25% to 35%, with rates consistently above 40% signaling underlying issues like poor scheduling or high absenteeism. Managing shrinkage effectively is critical to reducing customer hold times, controlling costs, and preventing agent burnout.
Digital & Omnichannel Engagement
Customers move between voice, chat, email, and social. These KPIs show whether non-voice experiences reduce effort and resolve issues without bouncing people back to the phone.
First Response Time (FRT)
First Response Time (FRT) tracks how quickly customers receive their first reply in digital channels. Prompt acknowledgment reduces customer uncertainty even before issues are resolved. According to Freshworks’ 2025 Customer Service Benchmark Report, top-performing organizations respond to digital inquiries within under 30 minutes on social media and under 1 hour via email. To ensure quality alongside speed, track first response times by channel and analyze them alongside resolution metrics. Speed should never come at the expense of substance.
Channel Mix
Channel Mix shows where customers actually reach you across voice (chat, email, and social) and what they expect from each. Zendesk’s 2024 CX Trends reports that 71% of organizations use digital channels for first contact and voice for complex or escalated issues (a useful guide for staffing and SLAs). Zendesk’s consumer data also shows phone jumps from 16% for general issues to 29% for complex problems, while email (16% to 13%), self-service (15% to 5%), and live chat (12% to 10%) decline as complexity rises, evidence that voice remains the preferred path when stakes are higher.
Digital Containment Rate
Digital Containment Rate is the share of issues resolved in self-service or automation (IVR, chatbots) without an agent. Even modest improvements have outsized impact: McKinsey reports that boosting IVR containment 5–20% and authentication rates by 15–25% can reduce call center costs by 10–30% in three to six months. Track containment by intent to learn which journeys can stay automated and which should escalate quickly to a person.
Turn Metrics Into Momentum
High-performing contact centers don’t chase every number. By tracking the right metrics, contact centers can uncover performance gaps, improve agent effectiveness, and build loyalty that lasts. Choose a balanced set across customer satisfaction, efficiency, agent productivity, quality, workforce planning, and digital engagement, then use those insights to coach, staff, and streamline processes. Start with a handful of KPIs from this guide, review them consistently, and tie coaching and workflow changes to what the data shows. Over time, metrics won’t just report results; they’ll help create them.
Make Every Call Count with Tomato.ai
Ready to turn your KPI playbook into outcomes? Tomato.ai helps teams improve clarity and performance with real-time agent assist, speech analytics, and accent softening so you can lift CSAT, raise FCR, and reduce AHT.
Request a demo to see how Tomato.ai can power your next CX win.
FAQs
What are the most important call center metrics?
It depends on your goals, but a balanced core often includes FCR, AHT, CSAT, NPS, and Service Level. These cover resolution quality, efficiency, satisfaction, and responsiveness.
How often should we review KPIs?
High-velocity metrics like AHT, Service Level, and Abandonment Rate are often reviewed daily; others like CSAT, NPS, and QA scores are reviewed weekly or monthly for trend analysis.
What’s the difference between metrics and KPIs?
Metrics are raw measures (e.g., call volume, wait time). KPIs are the subset tied directly to business goals, such as improving first contact resolution or reducing churn.
How do we avoid “gaming” the numbers?
Use a balanced scorecard so one KPI can’t be maximized at the expense of others. For example, monitor AHT alongside FCR and CSAT so speed doesn’t undercut quality.
Where should we start if we’re new to CX measurement?
Start with FCR, AHT, CSAT, and Service Level. Set realistic targets, create coaching plans, and revisit your scorecard every quarter.